How to create a confusion matrix with the test result in your training model using matplotlib

Short summary:
This article most the same as my previous article but with little changes:
If you want just to look at the notebook or just run code please click here
So, Let’s start :)
So I just to explain how to create a confusion matrix if you doing an image classification model.
At first, we need to create 3 folders ( testing, train, val )in our dataset like in the screenshot:

approximate count images files per folders:
testing — 5%
train — 15%
val — 80%
So folder “train” will use in the training model, folder “val” will use to show result per epoch. And “testing” folder will use only for the testing model in new images.
So at first, we need to define folder
# folders with train dir & val dirtrain_dir = '/content/flowers/train/'test_dir = '/content/flowers/val/'testing_dir = '/content/flowers/testing/'input_shape = (image_size, image_size, 3)
In the next step, we need to add image data generator for testing with shuffle parameter — FALSE
testing_datagen = ImageDataGenerator(rescale=1. / 255)testing_generator = testing_datagen.flow_from_directory(testing_dir,target_size=(image_size, image_size),batch_size=batch_size,shuffle=False,class_mode='categorical')
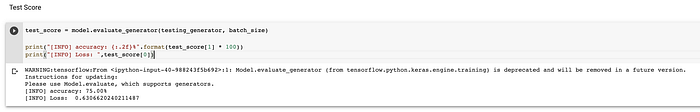
after the train the model we should run the next code to check the result in testing data
test_score = model.evaluate_generator(testing_generator, batch_size)print("[INFO] accuracy: {:.2f}%".format(test_score[1] * 100))print("[INFO] Loss: ",test_score[0])
we should have a result like this:
And run code to show confusion matrix with the test result in your training model
#Plot the confusion matrix. Set Normalize = True/Falsedef plot_confusion_matrix(cm, classes, normalize=True, title='Confusion matrix', cmap=plt.cm.Blues):
    """
    This function prints and plots the confusion matrix.
    Normalization can be applied by setting `normalize=True`.
    """
    plt.figure(figsize=(20,20))plt.imshow(cm, interpolation='nearest', cmap=cmap)
    plt.title(title)
    plt.colorbar()tick_marks = np.arange(len(classes))
    plt.xticks(tick_marks, classes, rotation=45)
    plt.yticks(tick_marks, classes)if normalize:
        cm = cm.astype('float') / cm.sum(axis=1)[:, np.newaxis]
        cm = np.around(cm, decimals=2)
        cm[np.isnan(cm)] = 0.0
        print("Normalized confusion matrix")
    else:
        print('Confusion matrix, without normalization')
    thresh = cm.max() / 2.
    for i, j in itertools.product(range(cm.shape[0]), range(cm.shape[1])):
        plt.text(j, i, cm[i, j],
                 horizontalalignment="center",
                 color="white" if cm[i, j] > thresh else "black")
    plt.tight_layout()
    plt.ylabel('True label')
    plt.xlabel('Predicted label')#Print the Target names
from sklearn.metrics import classification_report, confusion_matrix
import itertools
#shuffle=Falsetarget_names = []
for key in train_generator.class_indices:
    target_names.append(key)# print(target_names)#Confution MatrixY_pred = model.predict_generator(testing_generator)
y_pred = np.argmax(Y_pred, axis=1)
print('Confusion Matrix')
cm = confusion_matrix(testing_generator.classes, y_pred)
plot_confusion_matrix(cm, target_names, title='Confusion Matrix')#Print Classification Report
print('Classification Report')
print(classification_report(testing_generator.classes, y_pred, target_names=target_names))
we should have a result like this:
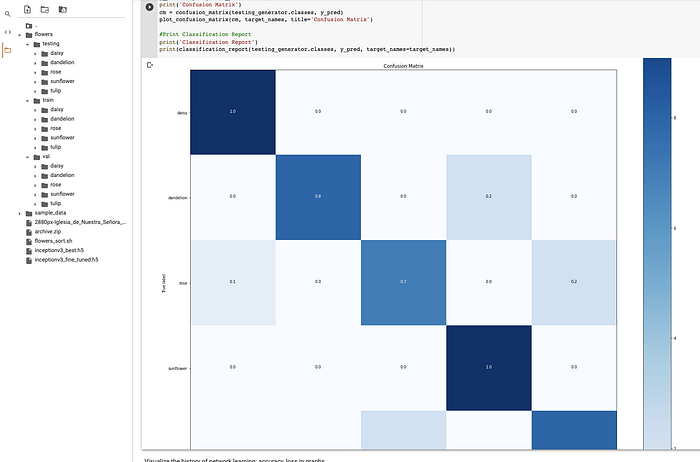
Result:
We created the confusion matrix via matplotlib.
If you want just to look at the notebook or just run code please click here

